Automating Project Reporting: A Comprehensive Approach with IXORD's Kanban and Metric Tools
May, 2024


May, 2024
In today's fast-paced business landscape, the importance of timely and accurate project reporting cannot be overstated. Consistent tracking of task progress, communication with teams and stakeholders, and appropriate response to change are all integral to successful project management. For many organizations, however, this process remains labor-intensive and frequently burdensome due to the use of inefficient tools and data handling methods.
IXORD introduces innovative solutions to this domain with its advanced tools - Kanban and Metrics. The IXORD Kanban board offers a visual and flexible approach to project management, allowing teams to more clearly track their tasks and workflows. Meanwhile, the Metrics tool allows for deep data analysis and automated reporting, speeding up the process and reducing the likelihood of errors.
In this article, we will explore how integrating these powerful tools can streamline your project reporting, provide a clearer picture of your project statuses, and open up new horizons for strategic planning and decision-making. We will delve into the functionalities of each tool and demonstrate how their combined use can enhance transparency and efficiency in your project processes.
Efficient project reporting is paramount to the success of any project management endeavor. Yet, project managers often face a multitude of challenges that hinder the accuracy and effectiveness of their reports.
Traditional project reporting can be a time-consuming and error-prone process. Manual data entry and compilation often lead to discrepancies and outdated information. Project managers struggle to maintain real-time visibility over project progress, which is compounded by the following issues:
Sifting through vast amounts of data to extract meaningful insights can be overwhelming.
Manual processes can cause significant delays in delivering reports, leading to outdated information that impedes informed decision-making.
Without a unified reporting framework, reports generated by different team members may lack consistency, making it difficult to gauge project health accurately.
Stakeholders often face challenges in accessing reports due to poor distribution channels or incompatible formats.
To combat these challenges, IXORD offers an integration of Kanban and Metrics tools designed to automate and streamline the project reporting process.
IXORD's Kanband board allows teams to visualize workflow and monitor the progress of individual tasks. By providing an always-up-to-date view of project status, teams can quickly generate reports that reflect the current state of affairs without the need for manual data entry.
With IXORD's Metrics tool, project managers can create custom performance indicators that align with their project's specific objectives. These metrics provide a standardized way to measure and report on project health, progress, and outcomes.
By leveraging real-time analytics from the Kanban and Metrics tools, IXORD streamlines the report generation process. This not only saves time but also ensures that stakeholders have immediate access to the latest data.
IXORD fosters an environment where reporting is collaborative and accessible. Reports can be shared across the team instantly, enabling quick feedback and decision-making.
By integrating these tools, IXORD's solutions facilitate a robust project reporting strategy that addresses common challenges and paves the way for efficient, standardized, and actionable project insights.
In the world of project management, the ability to quickly and accurately visualize the workflow and status of tasks is crucial. IXORD's Kanban board revolutionizes this aspect by providing a dynamic and interactive experience that promotes efficient task management and reporting.
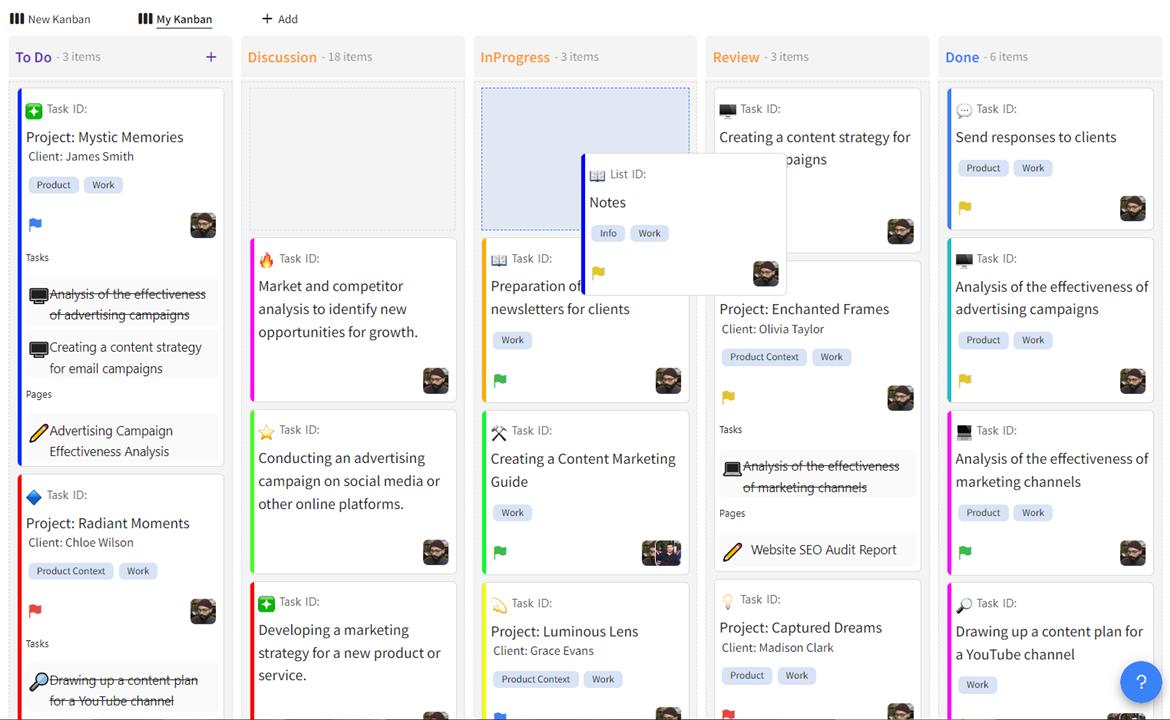
IXORD's Kanban is not just a static display of tasks, it is an engaging tool that allows for:
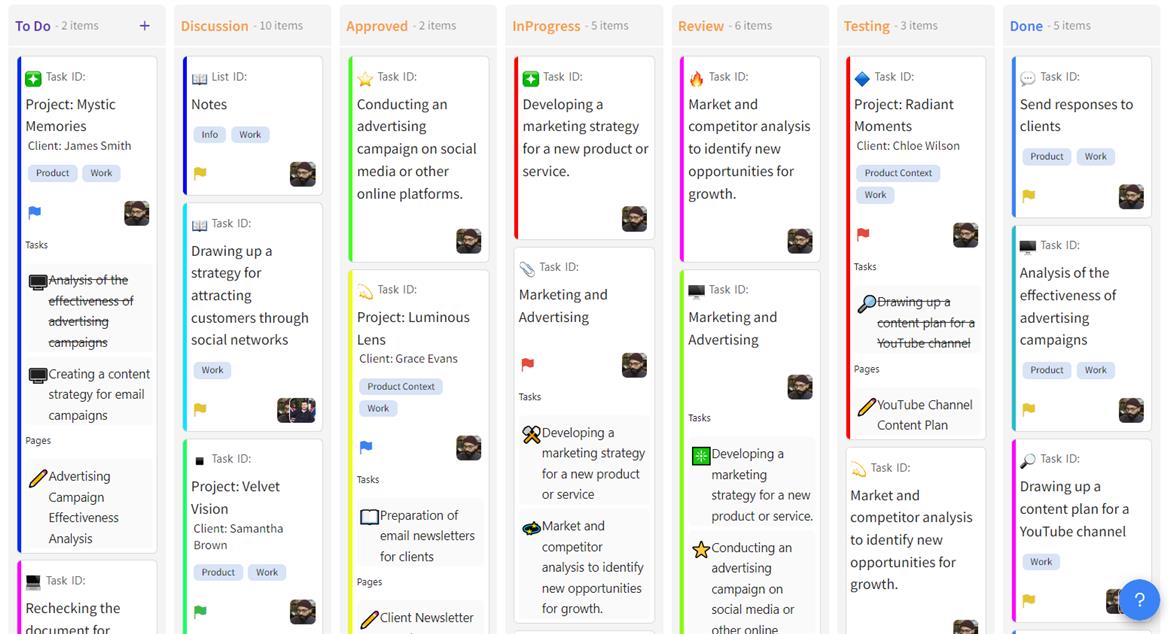
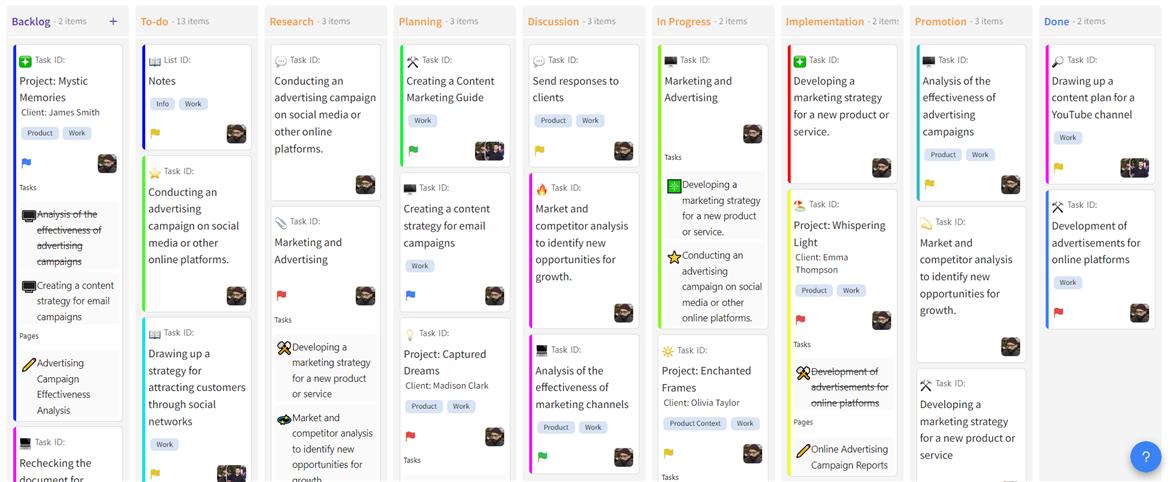
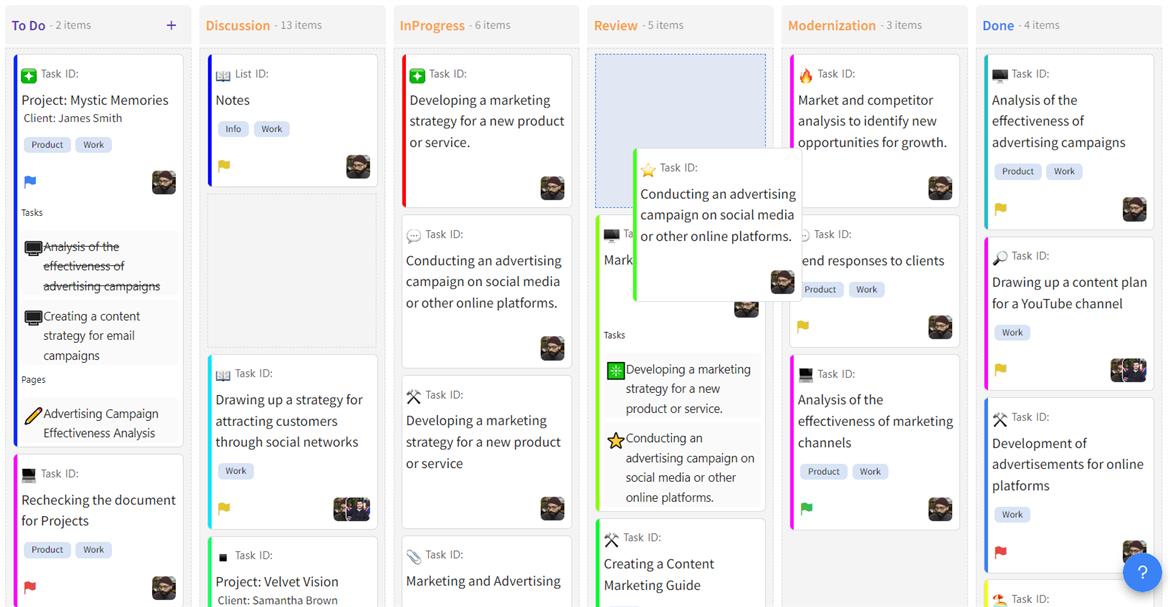
Each stage of the workflow is represented by a column, and users can tailor these to reflect their specific project stages, from "To Do" to "Done."
Tasks, represented as cards, can be moved effortlessly across columns to indicate their progress, making the workflow's evolution intuitively visible to all team members.
The use of labels, color codes, and progress bars within task cards provides immediate understanding of a task's status, priority, and type, facilitating a quick assessment of project health.
The Kanban board's real-time update capability ensures that project reporting is always based on the most current information. As team members update the status of tasks, these changes are immediately reflected on the board, which can be shared in reports to provide a live snapshot of project progress.
Benefits of IXORD's Kanban in Reporting
Stakeholders gain a clear view of how projects are advancing without needing to delve into the details.
As team members update the Kanban board, there is a clearer sense of individual and collective responsibility for task completion.
Automated updates reduce the need for manual report generation, allowing for more focus on actual project execution.
Kanban fosters a collaborative environment where team members can see how their work integrates with that of their colleagues, promoting better team coordination.
In conclusion, IXORD's Kanban delivers a transformative experience for project reporting by making project workflows visible, understandable, and easily communicable. It stands as an essential component for any team seeking to enhance their project management practices with real-time data visualization and responsive reporting tools.
Data-driven decisions are at the core of effective project management. IXORD's Metrics tool empowers teams to cut through the noise and focus on the data that truly matters. This section delves into how IXORD's Metrics tool enhances the project management experience by providing actionable insights through customized performance indicators.
IXORD's Metrics tool stands out with its flexibility, allowing project managers to create tailored metrics that align with their unique project goals. Whether it's tracking the sprint velocity, measuring defect rates, or monitoring resource allocation, IXORD enables precision tracking of the key performance indicators (KPIs) that are most relevant to your project's success.
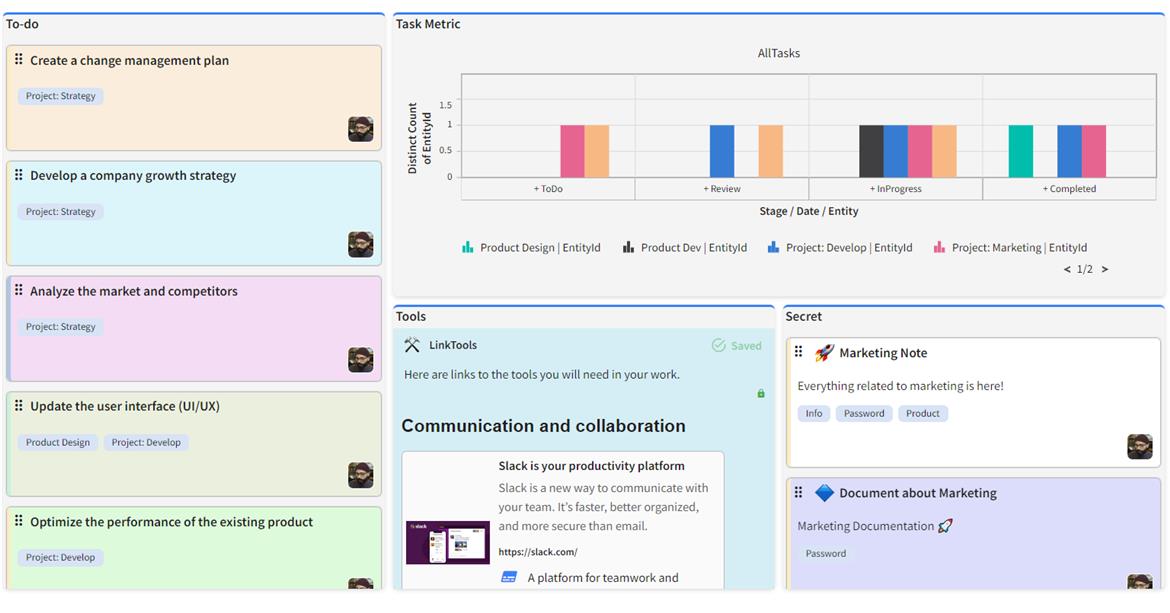
With an array of features designed to simplify data analysis, the Metrics tool offers:
Set up custom metrics without needing extensive technical knowledge. The intuitive interface guides users through metric creation, from initial definition to visualization.
Drill down into your metrics using advanced filtering options, ensuring you're viewing the exact data slice you need, whether by time period, team member, or any other project dimension.
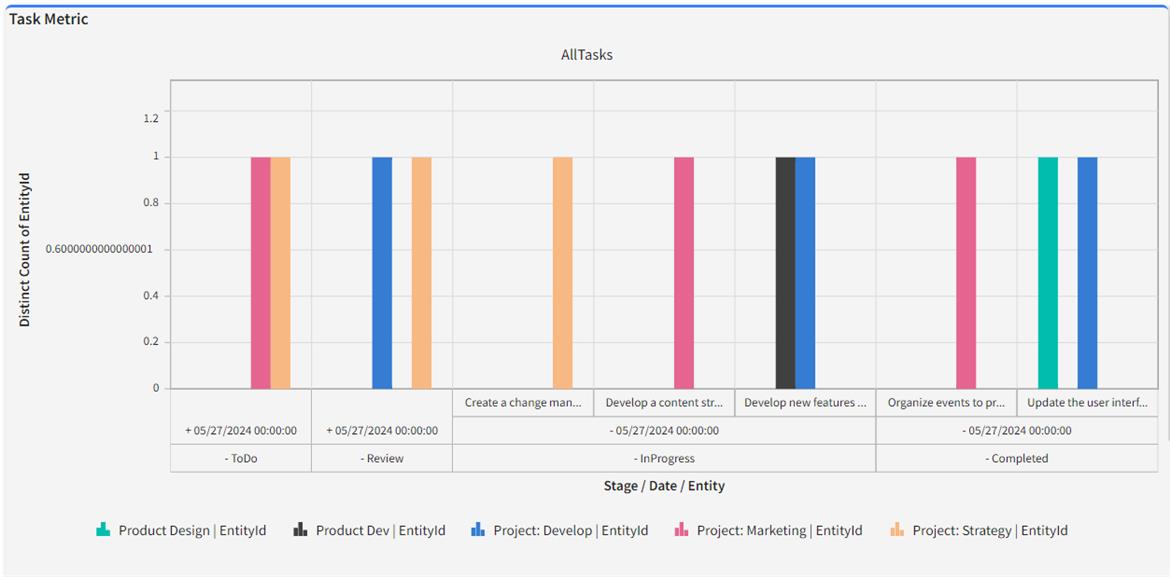
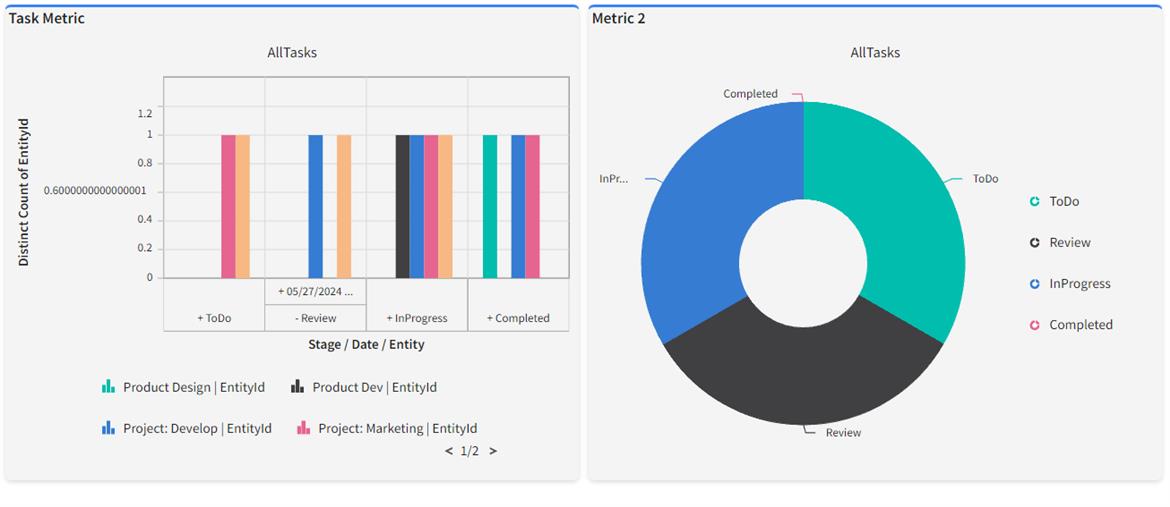
Convert raw data into easy-to-understand charts and graphs. Visual representations make trends and patterns stand out, facilitating quicker comprehension and more informed decision-making.
The tool gathers data directly from your project activities, ensuring that the numbers you're seeing are both accurate and up to date.
IXORD's Metrics tool brings clarity to complex data, enabling project managers and stakeholders to:
Recognize positive and negative trends early on to adjust project direction proactively.
Evaluate project progress against benchmarks and milestones, validating that objectives are met on schedule.
Assess team and individual performances, identifying both areas of strength and opportunities for improvement.
Share concise, data-centric reports with stakeholders that reveal the status and health of the project in an understandable format.
In summary, IXORD's Metrics tool is a powerhouse for project analytics, delivering a seamless user experience coupled with deep analytical capabilities. It is an invaluable asset for teams looking to harness the power of data for refined project reporting and insights.
The synergy between Kanban and Metrics within the IXORD platform represents a significant leap forward in project management and reporting capabilities. This powerful integration enables teams to streamline their workflow, ensure data consistency, and ultimately drive project success through enhanced reporting processes.
The concerted operation of IXORD’s Kanban and Metrics tools introduces a new level of efficiency by marrying real-time workflow updates with analytical insights. This integration allows for:
Information from the Kanban board automatically flows into the Metrics tool, ensuring that the analytics are always based on the latest project data.
Metrics are given context through the Kanban workflow stages, which helps in interpreting data and making informed decisions.
Generate reports that include both task progress visuals from Kanban and key data insights from Metrics, providing a holistic view of the project status.
The fusion of Kanban and Metrics simplifies the reporting process for project managers and teams by:
Data from different aspects of the project is compiled into a unified interface, reducing barriers between task management and performance analysis.
Automated updates from Kanban to Metrics eliminate the need for manual data entry, saving time and reducing the risk of errors.
With up-to-date analytics readily available, project managers can swiftly identify and address bottlenecks or discrepancies in the workflow.
Integrating IXORD’s Kanban and Metrics ensures that reports are not only timely but also accurate and informative:
Real-time updates mean that reports reflect the current state of the project, minimizing discrepancies.
Combining the Metrics tool's quantitative analysis with the Kanban board's qualitative insights produces reports that are both comprehensive and easy to interpret.
Stakeholders receive data-rich, visually compelling reports that support strategic decision-making and resource allocation.
In essence, the integration of IXORD’s Kanban and Metrics tools offers a compelling solution for teams looking to optimize their reporting processes. By bridging the gap between task management and data analysis, IXORD elevates the project reporting experience to a new level of sophistication and effectiveness.
Combining Kanban and Metrics tools offers a multifaceted approach to project management and reporting. This practical guide will walk you through the best practices and strategies for using these tools in tandem to maximize efficiency, clarity, and decision-making in your projects.
Customize your Kanban columns to mirror your project's workflow.
Add tasks as cards under the appropriate workflow stage.
Assign tasks to team members and use labels for quick identification of categories, priorities, or deadlines.
Determine which KPIs are most relevant to your project success and set them up in the Metrics tool.
Ensure your Metrics tool is linked to the Kanban board for real-time data updates.
Choose charts, graphs, or counters that best represent your project's data.
Periodically review the Kanban board to monitor task progress and workflow efficiency.
Use the Metrics tool to interpret underlying data trends relating to project performance.
Make necessary adjustments to tasks and processes based on insights gained from Kanban and Metrics analysis.
Utilize tools that allow for the creation of automated reports combining data from both Kanban and Metrics.
Customize reports for different audiences, choosing the level of detail and complexity required for each stakeholder.
Distribute reports on a regular basis to keep the team and stakeholders informed, fostering transparency and alignment.
Use feedback from reports to improve task management and performance tracking.
Adjust and evolve your KPIs as the project progresses to align with changing objectives and findings.
Apply lessons learned to further optimize your Kanban board structure and workflow.
Start with a limited set of KPIs to avoid overload and focus on those that offer the greatest insights.
Whenever there are adjustments to the Kanban board or Metrics, ensure the entire team is aware and understands the reasons for changes.
Set up alerts for thresholds within your Metrics tool to proactively manage potential issues before they escalate.
By following this guide, you can effectively merge the visual task management capabilities of a Kanban board with the analytical power of Metrics. This harmonization will empower you to manage projects with greater precision, provide insightful reports and ultimately, lead projects to their successful completion.
The automation of reporting is a pivotal element in project management and team operations, especially when utilizing the integration of Kanan and Metrics. Let's explore the main benefits that automated reporting brings when these tools are deployed together.
Automation allows for data to be updated in real time, facilitating a timely assessment of the project's current state and process efficiency.
With integrated tools, the team is always equipped with the most recent data and reports at their disposal, easing information sharing and decision-making.
Automation eliminates the need for manual data entry, lightening the team’s workload and decreasing the likelihood of errors.
The integration of tools enables the automatic generation of reports, freeing up time for the team to focus on more complex tasks.
Automatic data updating reduces human error and increases the accuracy of reporting.
Working with the freshest data provides a complete and precise view of project statuses.
Automated reports help to better understand the impact of various project aspects on key performance indicators (KPIs).
Data analysis allows project managers to anticipate trends and risks early on, taking proactive steps before potential issues impact the project.
When reports and metrics are accessible to all team members, it fosters a more profound understanding of project goals and each person's role in achieving them.
A visualization of progress and individual contributions motivates the team and reinforces focus on collective goals.
Regular and accurate reports allow for monitoring the process and making incremental improvements based on concrete data.
Project managers can observe KPI dynamics and make real-time adjustments to the project for optimal outcomes.
Automated reporting with Kanban and Metrics transforms the way projects are managed, making the reporting processes less labor-intensive and more accurate, and oriented towards achieving results. The effective use of integrated tools empowers teams to achieve higher levels of productivity and quality in project activities.
To provide a practical understanding of how combining Kanban and Metrics can lead to success, let's delve into real-life case studies from different companies that have effectively integrated these practices into their operations.
A tech startup was struggling with delayed releases and lack of visibility in its software development cycle.
By incorporating a Kanban system with real-time Metrics, the company created a visual workflow for all phases of development, from ideation to deployment. Key metrics such as lead time, cycle time, and sprint burndown were tracked meticulously.
The clarity provided by the Kanban board, paired with insights from Metrics, led to better priority setting and resource allocation. This resulted in a 40% reduction in time-to-market for new features and a significant increase in customer satisfaction due to improved product delivery times.
A manufacturing firm faced issues with inventory management and bottlenecks in production, causing delayed orders and wasted resources.
The firm implemented a factory-wide Kanban system linked to an analytics platform monitoring various metrics from machine output to quality control data.
The visualization of the production process and continuous monitoring of metrics enabled the firm to quickly identify and resolve bottlenecks. Inventory levels were optimized, leading to a 25% increase in production efficiency and a reduction in waste.
A healthcare provider was experiencing long patient wait times and inconsistent service quality, affecting patient satisfaction.
The provider introduced a Kanban workflow for patient management and tracking, coupled with metrics such as wait times, treatment times, and patient turnover rates.
With better workflow management and actionable data from Metrics, the provider was able to streamline operations, reduce patient wait times by 35%, and improve service consistency, which positively impacted patient feedback and retention.
A marketing agency was dealing with project overruns and poor coordination between creative teams, leading to client frustration.
Kanban boards were used to manage each client project, with Metrics monitoring progress, creative output, and team performance.
The clear visual representation of each project and performance data helped align team efforts with client expectations. The agency experienced a 50% increase in on-time project delivery and a marked improvement in client satisfaction.


